Whistler (all property types): Total Active listings (223) – 3% decrease Total Sales volume (30) – 25% decrease Average Sale price ($2,228,208) –38% increase
Whistler Nightly rental properties (Phase One): Total Active listings (65) – 12% increase Total Sales volume (14) – 75% increase Average Sale price ($1,613,571) – 5% increase
Whistler Single Family Homes: Total Active listings (70) – 9% increase Total Sales Volume (4) – 50% decrease Average Sale price ($6,218,500) – 36% increase
Pemberton: Total Active Listings (82) –44% increase Total Sales volume (8) – 14% increase Average sale price ($852,113) – 35% increase
Whistler (all property types):
Total Active listings (219) – 1% increase
Total Sales volume (35) – even
Average Sale price ($2,693,971) –30% increase
Whistler Nightly rental properties (Phase One): Total Active listings (66) – 8% increase Total Sales volume (12) – 50% increase Average Sale price ($1,993,333) – 2% decrease
Whistler Single Family Homes: Total Active listings (58) – 5% increase Total Sales volume (5) – 505 decrease Average Sale price ($9,175,000) – 191% increase
Pemberton: Total Active listings (74) – 10% increase Total Sales volume (2) – 85% decrease Average Sale price ($922,500) – 18% decrease
Let’s talk about the second quarter of 2023 in the Whistler and Pemberton real estate markets.
Building on the end of Q1 market momentum, April remained a busy month in terms of sales, which got even busier in May before slowing down in June. The June slowdown likely came as a function of the interest rate increase announcement at the beginning of the month, coupled with an expectation that the government is not yet done raising rates. Overall market inventory increased but remained low, which led to the return of many multiple offer situations in certain market segments.
Whistler Real Estate Market
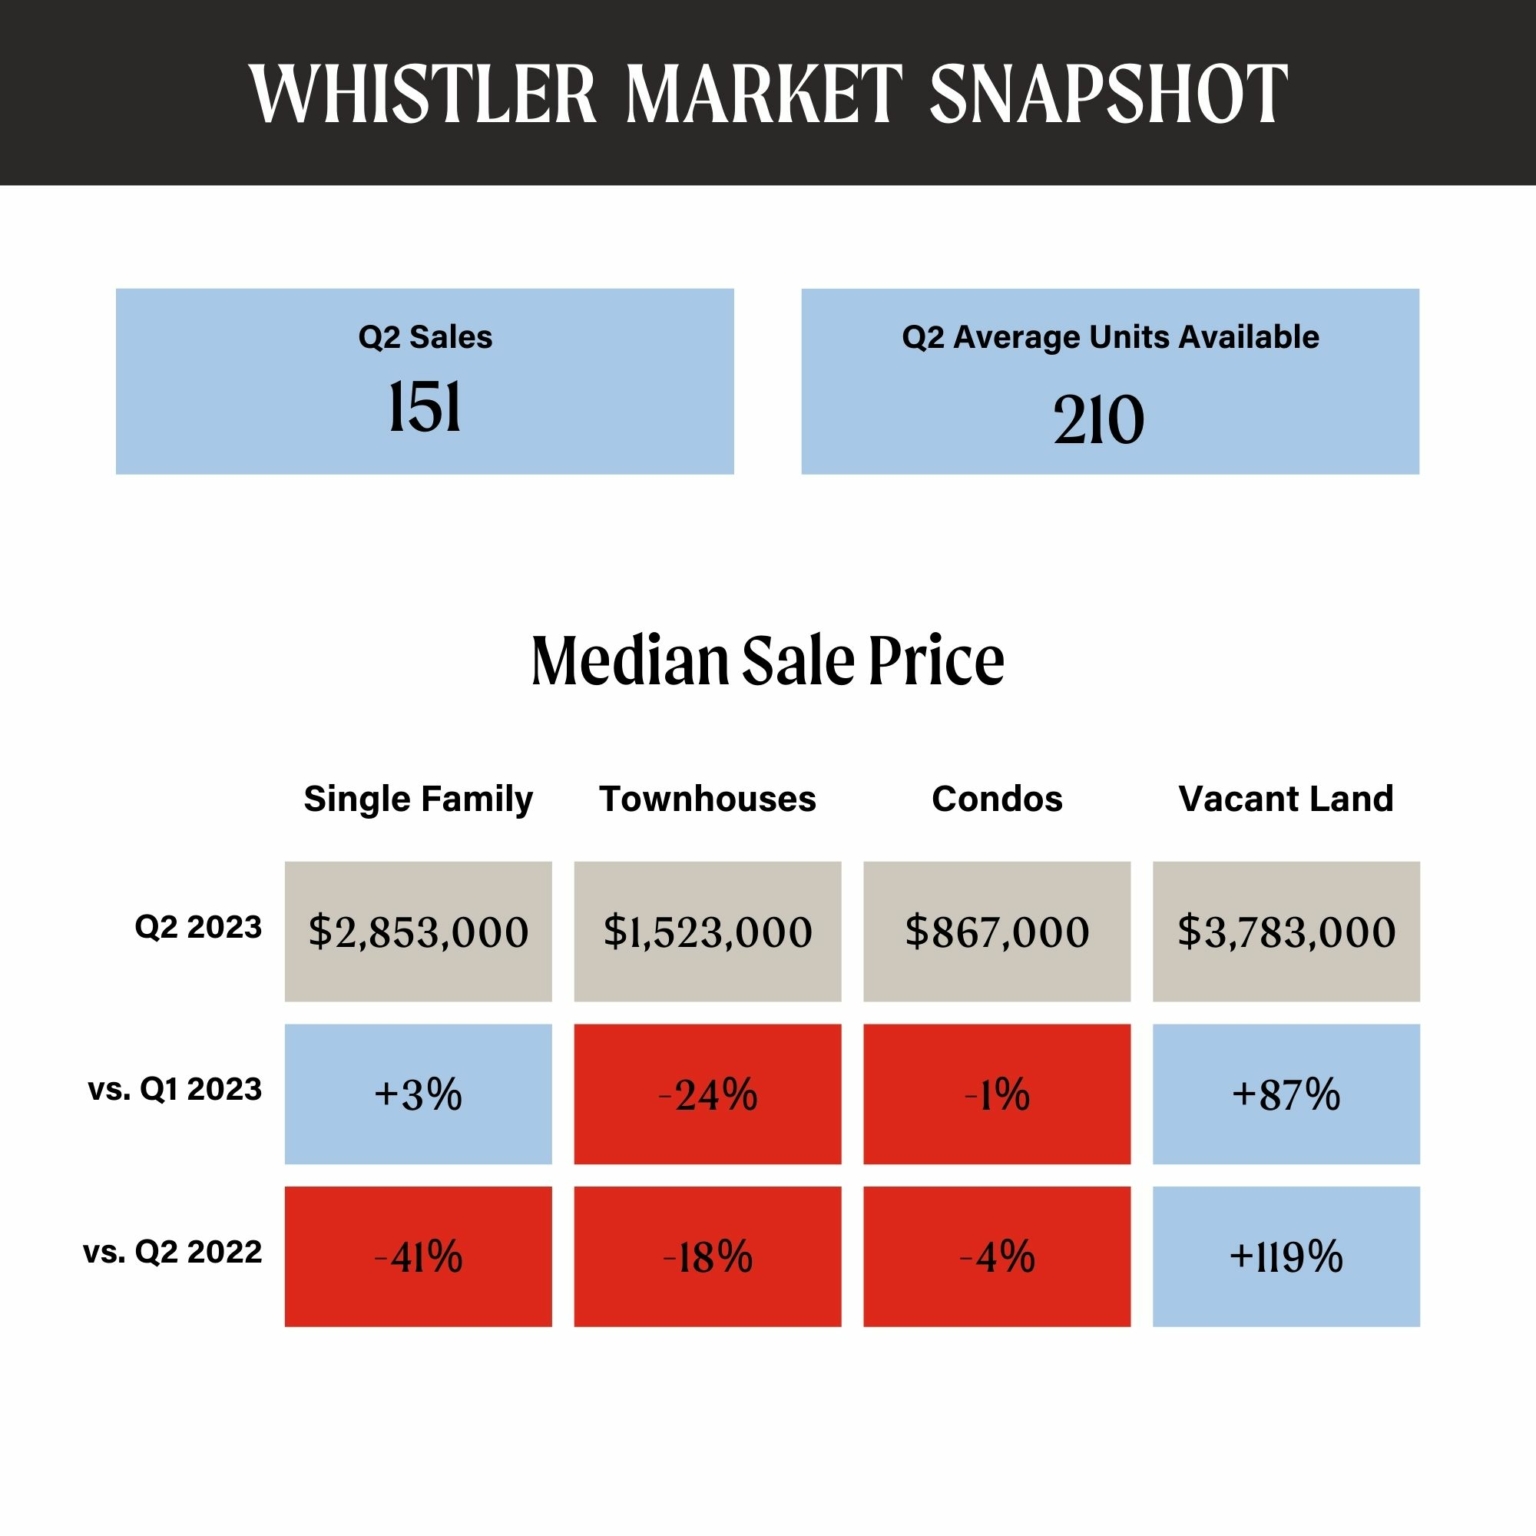
In Whistler, there were a total of 151* sales in Q2, with 78% of those coming in April and May. Sales volume was up significantly both year-over-year and quarter-over-quarter for single-family homes and townhomes, with a slight increase also seen in the condo category. While still historically low, inventory increased throughout the quarter, rising 13% from 205* units in April to 232* units in June. There was notable activity in the luxury market in Q2, with 11 sales over $4M, compared to 7 in Q1, with a high sale price of $19M.
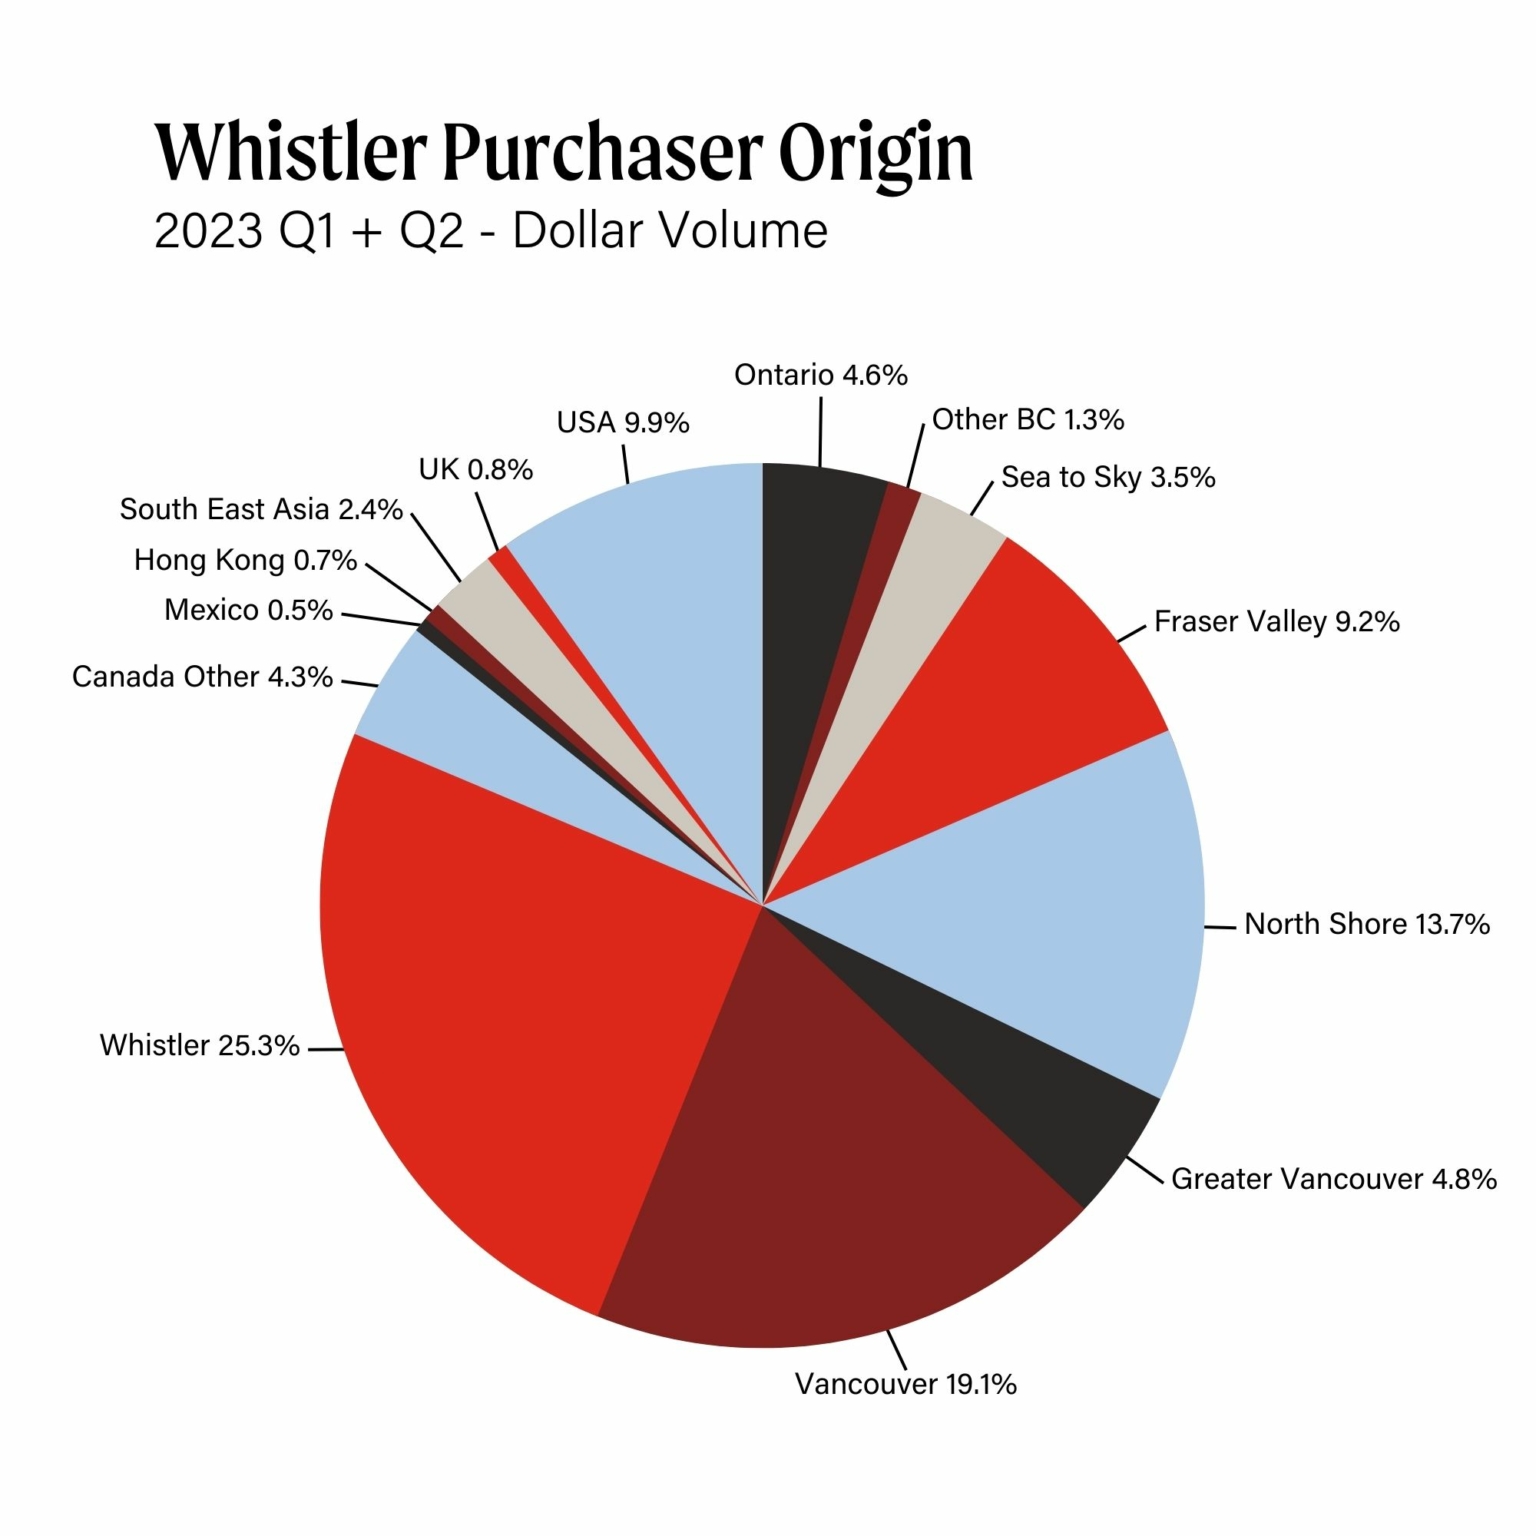
Through the first half of the year, our buyer’s origin remained in its typical pattern, with 79% of Whistler buyers having originated from Whistler or BC’s Lower Mainland, with an additional 9% of buyers coming from other regions in Canada and 12% of buyers coming from outside of Canada.
Looking to Q3, we anticipate the typical summer market pace seen in Whistler, with a pickup in September, when buyers are actively searching for properties they can move into for the upcoming snow season. However, as inventory levels have improved and we have seen a shift towards a buyer’s market, it may be prudent for interested buyers to start their search now to have more choices and avoid peak competition.
Pemberton Real Estate Market
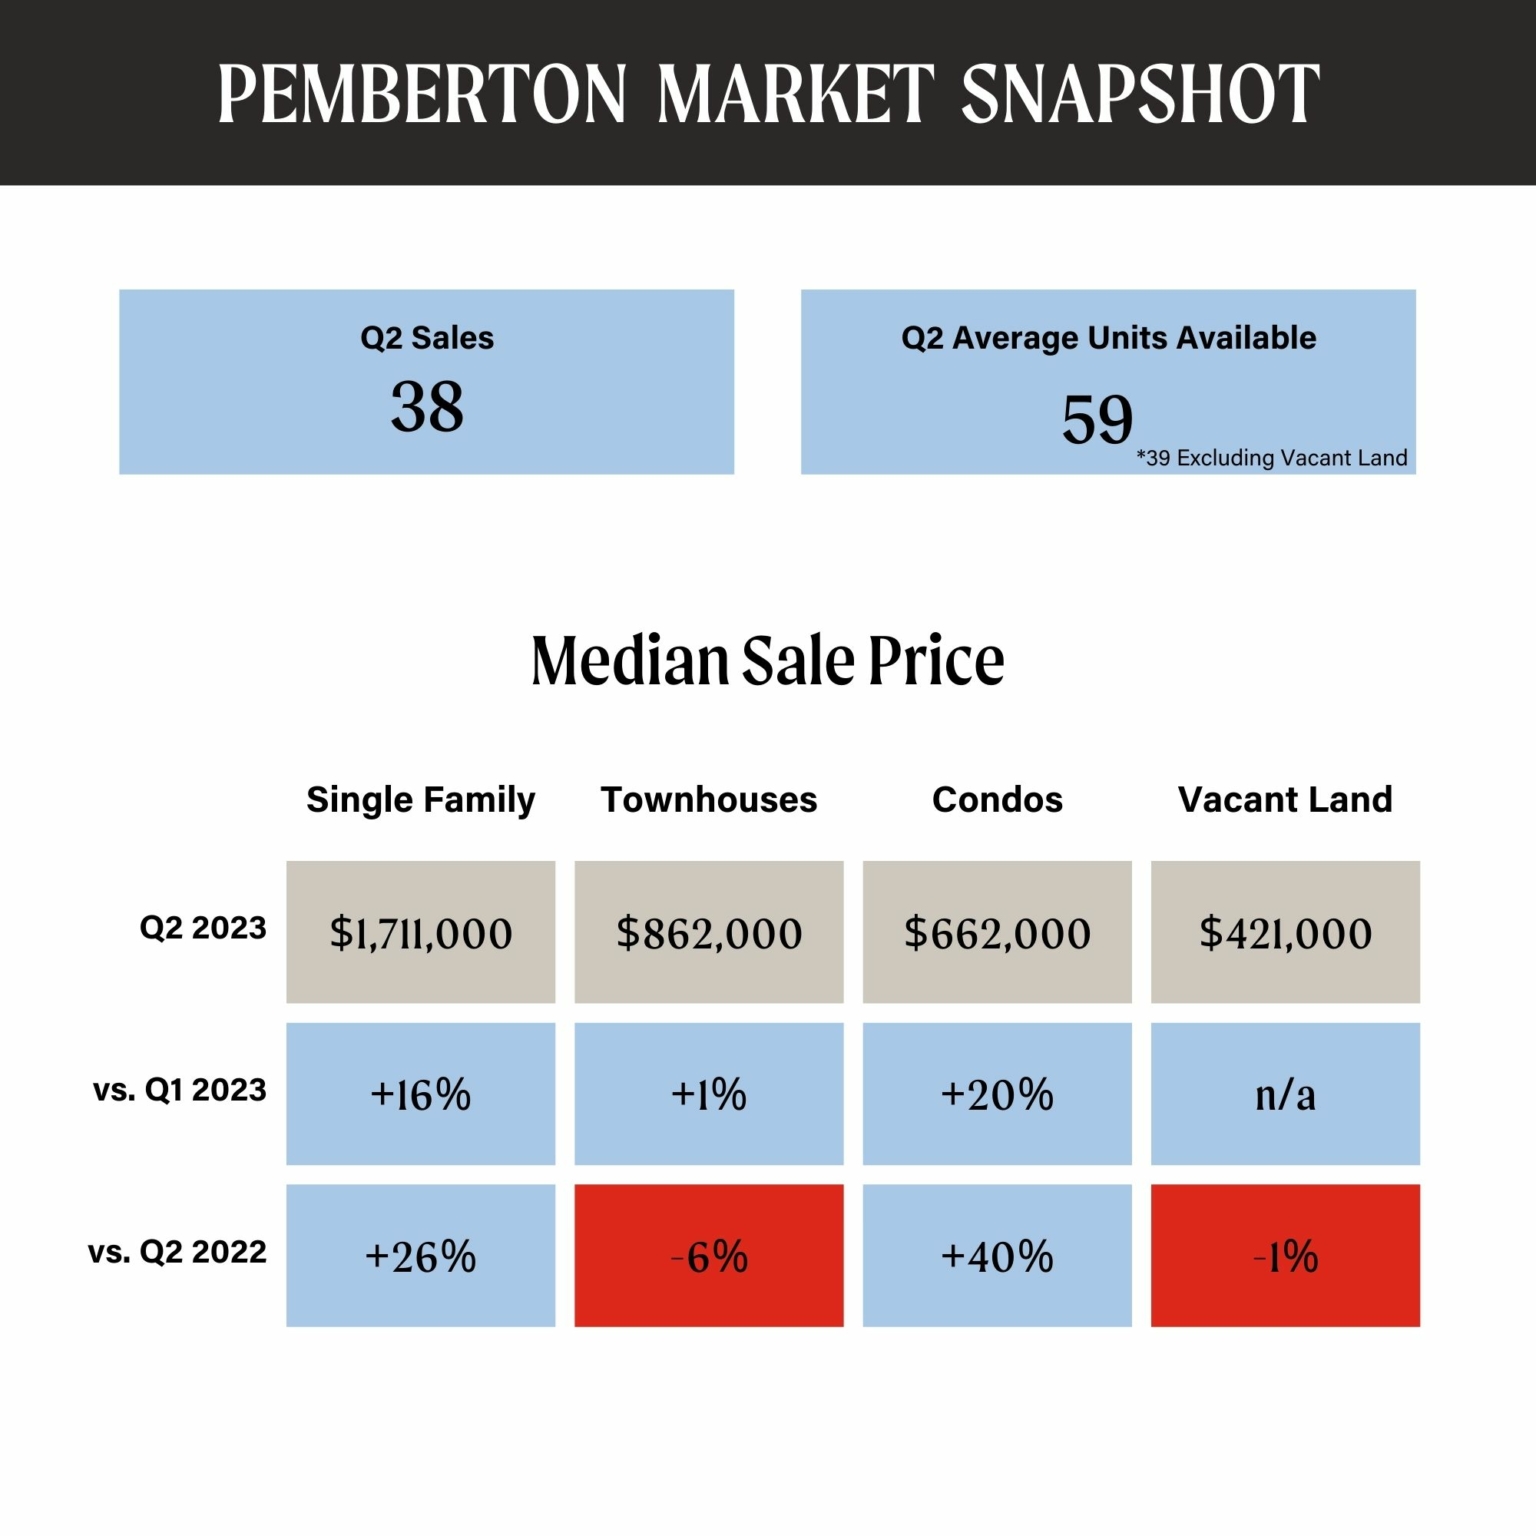
In Pemberton, there were a total of 38* sales in Q2, a 52% increase from Q1. Inventory levels also increased throughout the quarter from 53* units in April to 67* in June. The median sale price for both single-family homes and condos has risen significantly year over year.
In regards to luxury sales in Pemberton, there were 4 sales over $2M in Q2. This is a notable pick-up in this market segment, as there was only 1 sale over this threshold in Q1 and a total of 3 for all of 2022.
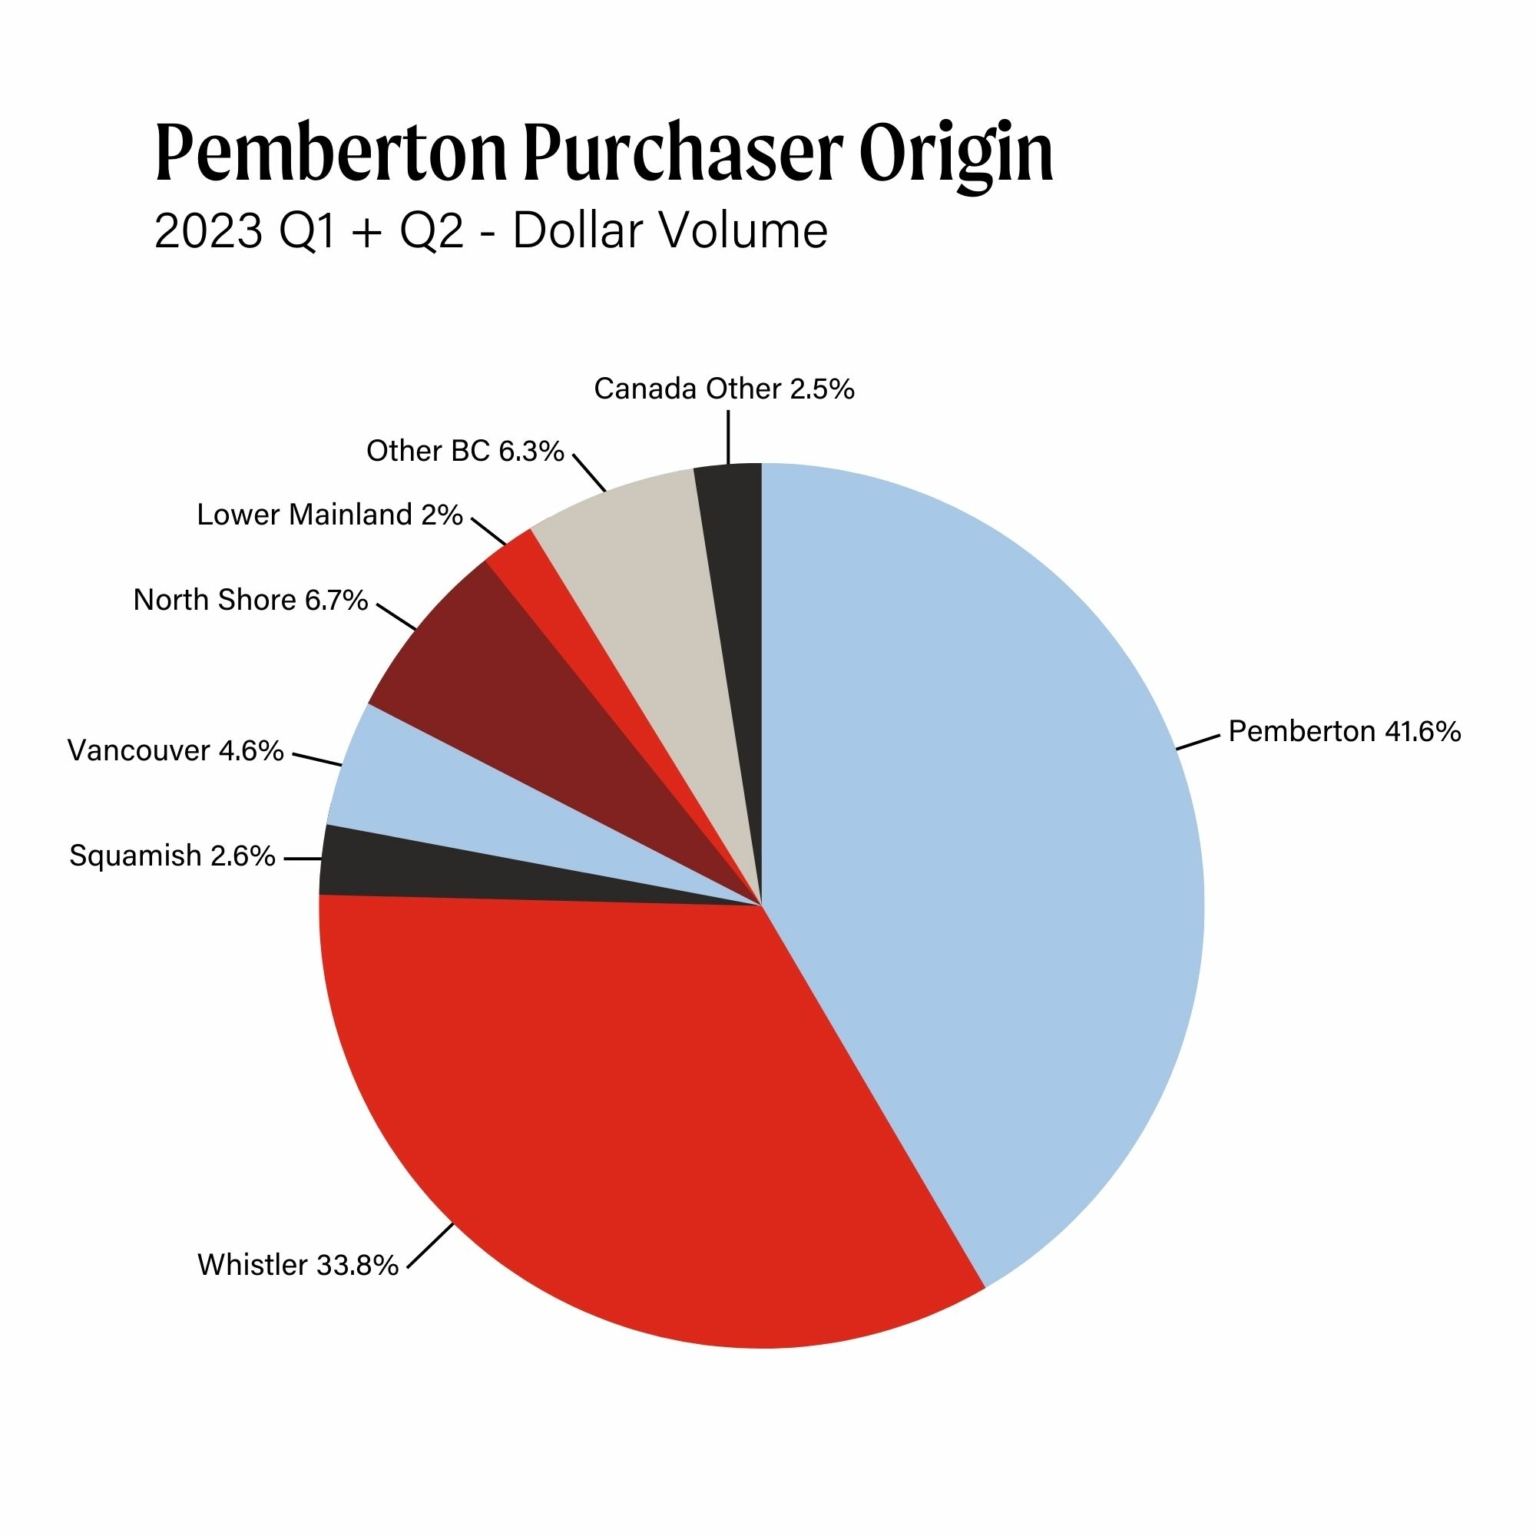
Year to date, Pemberton has had 17% more transactions and 25% more dollar volume in sales than the market at this same time last year. 75% of Pemberton buyers year-to-date have been either Pemberton or Whistler based, with 17% coming from the Greater Vancouver Area and Lower Mainland and 8% coming from other parts of BC or Canada.
We expect the momentum in Pemberton to continue throughout the summer as more move-in-ready inventory is available. However, we could see a shift to a lower average price point due to the continued interest rate increases.
Whistler (all property types): Total Active listings (217) – 20% increase Total Sales volume (35) – 31% decrease Average Sale price ($2,075,403) –46% increase
Whistler Nightly rental properties (Phase One): Total Active listings (26) – 41% decrease Total Sales volume (8) – 60% decrease Average Sale price ($2,036,313) – 1% decrease
Whistler Single Family Homes: Total Active listings (55) – 4% increase Total Sales Volume (10) – 100% increase Average Sale price ($4,854,550) – 84% increase
Pemberton: Total Active Listings (67) –20% increase Total Sales volume (13) – even Average sale price ($1,125,885) – 20% increase
Whistler (all property types): Total Active listings (181) – 12% decrease Total Sales volume (51) – no change Average Sale price ($1,420,753) –17% decrease
Whistler Nightly rental properties (Phase One): Total Active listings (44) – no change Total Sales volume (20) – 13% decrease Average Sale price ($2,063,508) – 17% increase
Whistler Single Family Homes: Total Active listings (53) – 13% increase Total Sales Volume (5) – 29% decrease Average Sale price ($2,632,000) – 40% decrease
Pemberton: Total Active Listings (56) – 6% increase Total Sales volume (13) – 44% increase Average sale price ($936,769) – 20% decrease
Whistler (all property types): Total Active listings (205) – 6% decrease Total Sales volume (51) – 6% increase Average Sale price ($1,714,544) – 2% increase
Whistler Nightly rental properties (Phase One): Total Active listings (44) –21% decrease Total Sales volume (23) – 35% increase Average Sale price ($1,765,054) – even
Whistler Single Family Homes: Total Active listings (47) – 2% decrease Total Sales Volume (7) – 13% decrease Average Sale price ($4,416,286) – 48% increase
Pemberton: Total Active Listings (53) – 6% increase Total Sales volume (9) – 36% decrease Average sale price ($1,168,667) – 6% increase
Real Estate Market Report: Let’s talk about the first quarter of 2023 in the Whistler and Pemberton real estate markets.
January 2023 was a very slow month in terms of sales, but the markets rebounded in February and March. This came as a function of increased economic certainty, as the Bank of Canada has signalled that interest rate increases have likely come to an end. The return of some certainty in terms of rates has led to an increase in market activity, with our inventory still being low this has even resulted in us seeing the return of multiple offers.
Whistler (all property types): Total Active listings (217) – 6% increase Total Sales volume (48) – 23% increase Average Sale price ($1,688,335) – 16% decrease
Whistler Nightly rental properties (Phase One): Total Active listings (56) –10% increase Total Sales volume (17) – 31% increase Average Sale price ($1,766,006) – 31% decrease
Whistler Single Family Homes: Total Active listings (48) – 4% increase Total Sales Volume (8) – 33% increase Average Sale price ($2,975,938) – 29% decrease
Pemberton: Total Active Listings (50) – 7% decrease Total Sales volume (14) – 180% increase Average sale price ($1,104,714) – 2% increase
Whistler (all property types):
Total Active listings (205) – 6% increase Total Active listings (205) – 6% increase Total Sales volume (39) – 144% increase Average Sale price ($2,017,179) – 55% increase
Whistler Nightly rental properties (Phase One): Total Active listings (51) –2% decrease Total Sales volume (13) – 160% increase Average Sale price ($2,555,038) – 98% increase
Whistler Single Family Homes: Total Active listings (46) – 10% increase
Total Sales Volume (6) – 100% increase
Average Sale price ($4,193,333) – 42% increase
Pemberton:
Total Active Listings (54) – 13% increase
Total Sales volume (5) – 25% increase
Average sale price ($1,080,835) – 24% increase
Whistler (all property types): Total Active listings (194) – 4% increase Total Sales volume (16) – 56% decrease Average Sale price ($1,302,094) – 40% decrease
Whistler Nightly rental properties (Phase One): Total Active listings (52) –24% increase Total Sales volume (5) – 38% decrease Average Sale price ($1,290,000) – 31% decrease
Whistler Single Family Homes: Total Active listings (42) – 9% decrease Total Sales Volume (3) – 67% decrease Average Sale price ($2,963,333) – 39% decrease
Pemberton: Total Active Listings (48) – 4% increase Total Sales volume (4) – 67% decrease Average sale price ($869,750) – 32% decrease